/dev/reading
Category

R

9 books
Order by
View
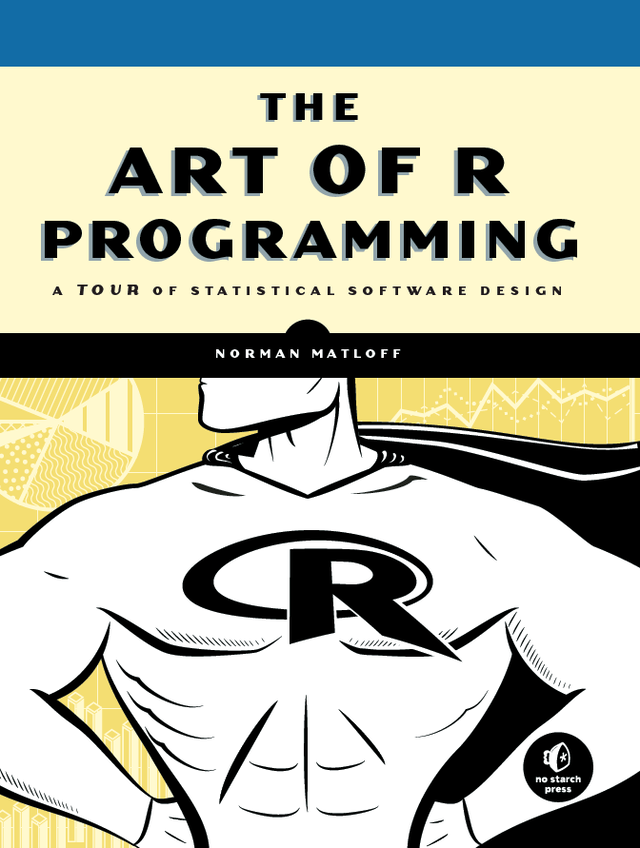
A Tour of Statistical Software Design
by Norman Matloff

R is the world's most popular language for developing statistical software: Archaeologists use it to track the spread of ancient civilizations, drug companies use it to discover which medications are safe and effective, and actuaries use it to assess financial risks and keep economies running smoothly.

The Art of R Programming takes you on a guided tour of software development with R, from basic types and data structures to advanced topics like closures, recursion, and anonymous functions. No statistical knowledge is required, and your programming skills can range from hobbyist to pro.

Along the way, you'll learn about functional and object-oriented programming, running mathematical simulations, and rearranging complex data into simpler, more useful formats. You'll also learn to:

  • Create artful graphs to visualize complex data sets and functions
  • Write more efficient code using parallel R and vectorization
  • Interface R with C/C++ and Python for increased speed or functionality
  • Find new R packages for text analysis, image manipulation, and more
  • Squash annoying bugs with advanced debugging techniques

Whether you're designing aircraft, forecasting the weather, or you just need to tame your data, The Art of R Programming is your guide to harnessing the power of statistical computing.
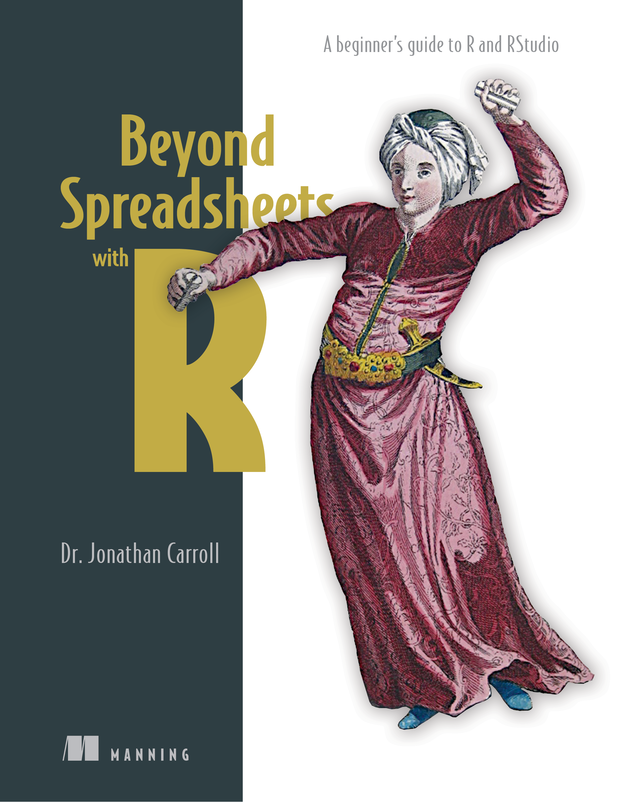
A beginner's guide to R and RStudio
by Dr. Jonathan Carroll

Beyond Spreadsheets with R shows you how to take raw data and transform it for use in computations, tables, graphs, and more. You’ll build on simple programming techniques like loops and conditionals to create your own custom functions. You’ll come away with a toolkit of strategies for analyzing and visualizing data of all sorts using R and RStudio.

A First Course in Programming and Statistics
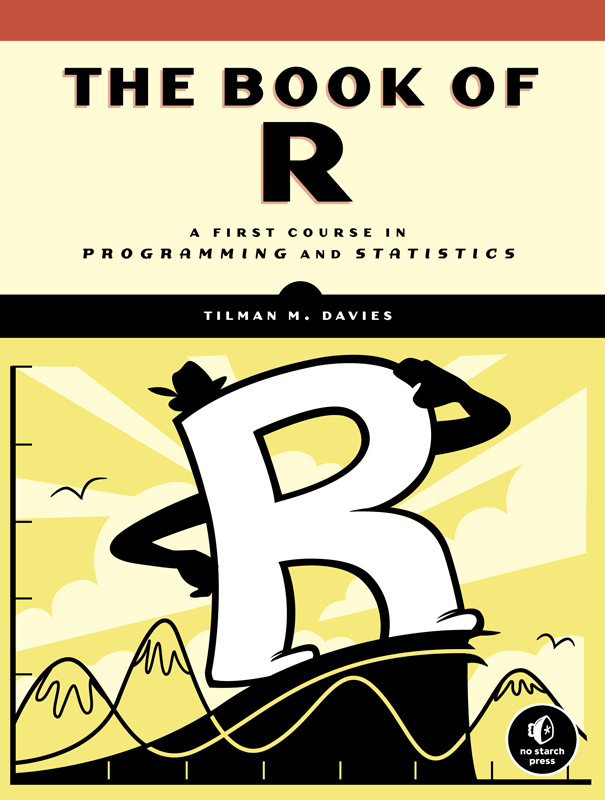
by Tilman M. Davies

The Book of R is a comprehensive, beginner-friendly guide to R, the world’s most popular programming language for statistical analysis. Even if you have no programming experience and little more than a grounding in the basics of mathematics, you’ll find everything you need to begin using R effectively for statistical analysis.

You’ll start with the basics, like how to handle data and write simple programs, before moving on to more advanced topics, like producing statistical summaries of your data and performing statistical tests and modeling. You’ll even learn how to create impressive data visualizations with R’s basic graphics tools and contributed packages, like ggplot2 and ggvis, as well as interactive 3D visualizations using the rgl package.

Dozens of hands-on exercises (with downloadable solutions) take you from theory to practice, as you learn:

  • The fundamentals of programming in R, including how to write data frames, create functions, and use variables, statements, and loops
  • Statistical concepts like exploratory data analysis, probabilities, hypothesis tests, and regression modeling, and how to execute them in R
  • How to access R’s thousands of functions, libraries, and data sets
  • How to draw valid and useful conclusions from your data
  • How to create publication-quality graphics of your results

Combining detailed explanations with real-world examples and exercises, this book will provide you with a solid understanding of both statistics and the depth of R’s functionality. Make The Book of R your doorway into the growing world of data analysis.

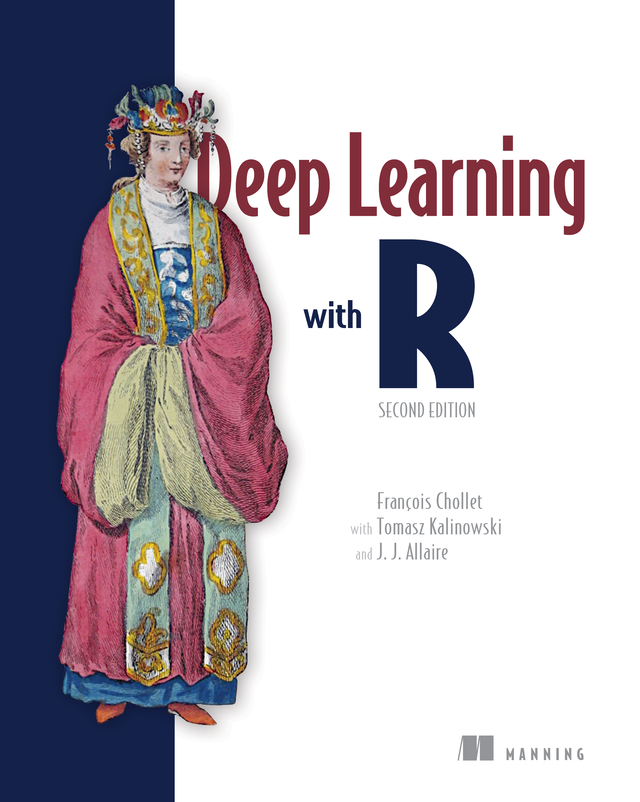
by François Chollet, Tomasz Kalinowski and J. J. Allaire

Deep learning from the ground up using R and the powerful Keras library!

In Deep Learning with R, Second Edition you will learn:

  • Deep learning from first principles
  • Image classification and image segmentation
  • Time series forecasting
  • Text classification and machine translation
  • Text generation, neural style transfer, and image generation

Deep Learning with R, Second Edition shows you how to put deep learning into action. It’s based on the revised new edition of François Chollet’s bestselling

Deep Learning with Python. All code and examples have been expertly translated to the R language by Tomasz Kalinowski, who maintains the Keras and Tensorflow R packages at RStudio. Novices and experienced ML practitioners will love the expert insights, practical techniques, and important theory for building neural networks.

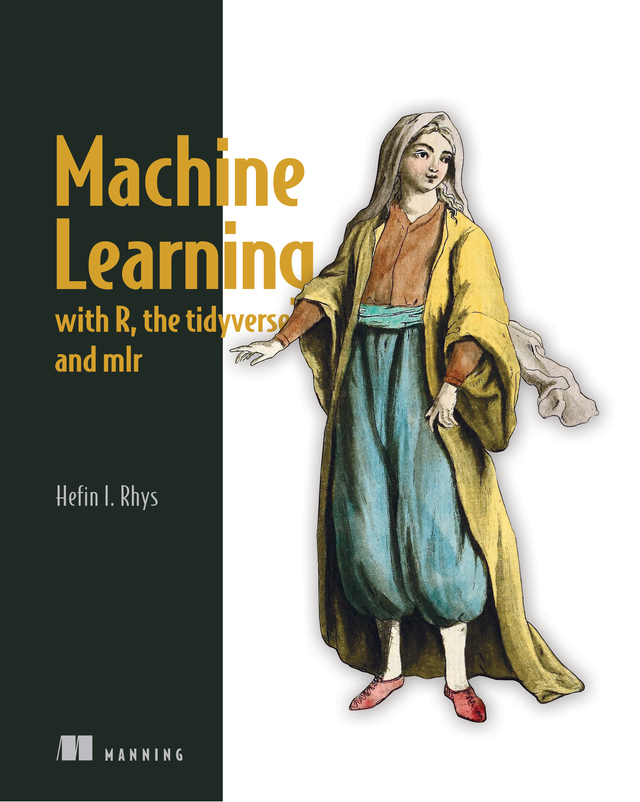
by Hefin I. Rhys

Machine learning (ML) is a collection of programming techniques for discovering relationships in data. With ML algorithms, you can cluster and classify data for tasks like making recommendations or fraud detection and make predictions for sales trends, risk analysis, and other forecasts. Once the domain of academic data scientists, machine learning has become a mainstream business process, and tools like the easy-to-learn R programming language put high-quality data analysis in the hands of any programmer.

Machine Learning with R, the tidyverse, and mlr teaches you widely used ML techniques and how to apply them to your own datasets using the R programming language and its powerful ecosystem of tools. This book will get you started!

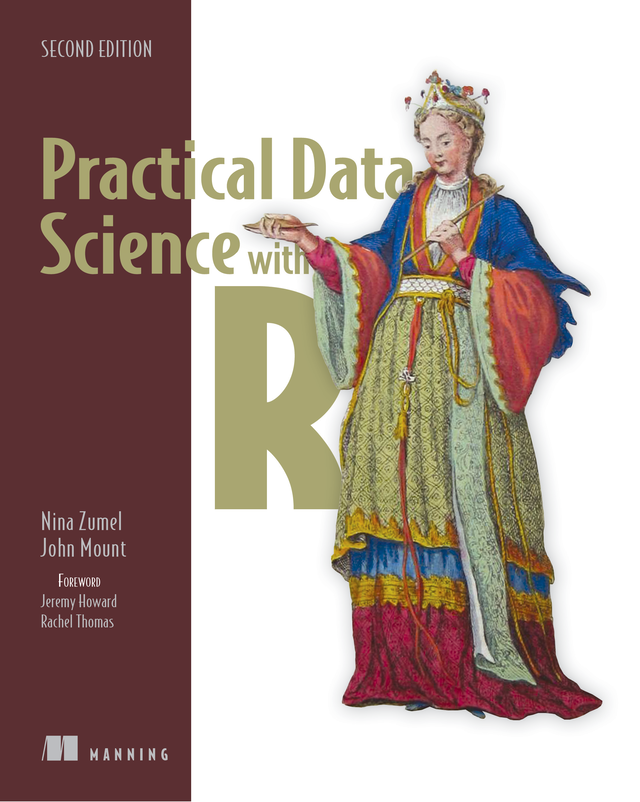
by Nina Zumel and John Mount

Practical Data Science with R, Second Edition takes a practice-oriented approach to explaining basic principles in the ever expanding field of data science. You’ll jump right to real-world use cases as you apply the R programming language and statistical analysis techniques to carefully explained examples based in marketing, business intelligence, and decision support.

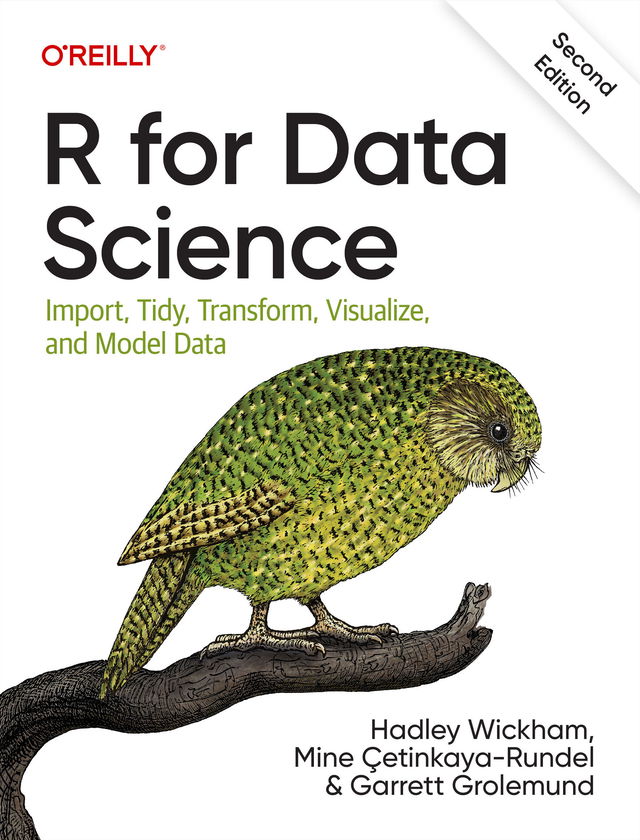
Import, Tidy, Transform, Visualize and Model Data
by Hadley Wickham, Mine Çetinkaya-Rundel and Garrett Grolemund

Use R to turn data into insight, knowledge, and understanding. With this practical book, aspiring data scientists will learn how to do data science with R and RStudio, along with the tidyverse—a collection of R packages designed to work together to make data science fast, fluent, and fun. Even if you have no programming experience, this updated edition will have you doing data science quickly.

You'll learn how to import, transform, and visualize your data and communicate the results. And you'll get a complete, big-picture understanding of the data science cycle and the basic tools you need to manage the details. Updated for the latest tidyverse features and best practices, new chapters show you how to get data from spreadsheets, databases, and websites. Exercises help you practice what you've learned along the way.

You'll understand how to:

  • Visualize: Create plots for data exploration and communication of results
  • Transform: Discover variable types and the tools to work with them
  • Import: Get data into R and in a form convenient for analysis
  • Program: Learn R tools for solving data problems with greater clarity and ease
  • Communicate: Integrate prose, code, and results with Quarto
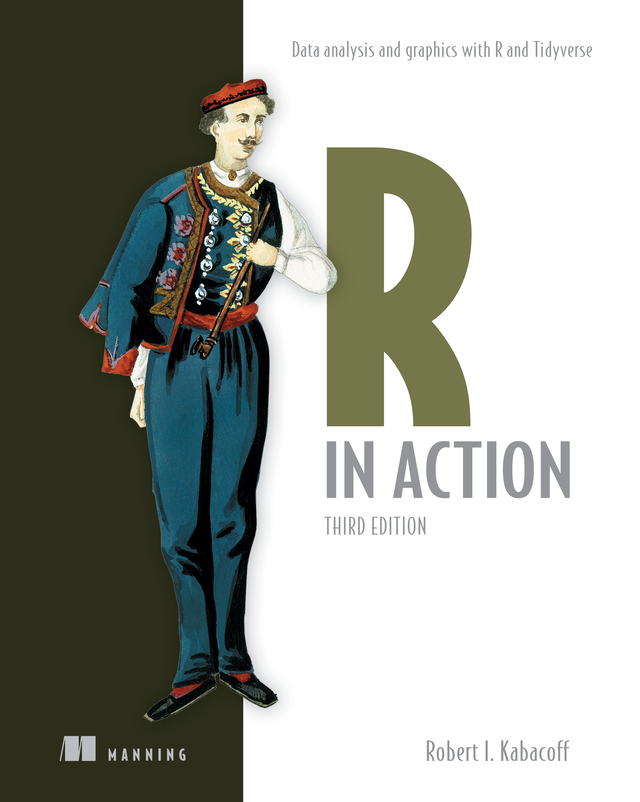
Data analysis and graphics with R and Tidyverse
by Robert I. Kabacoff

R is the most powerful tool you can use for statistical analysis. This definitive guide smooths R’s steep learning curve with practical solutions and real-world applications for commercial environments.

In R in Action, Third Edition you will learn how to:

  • Set up and install R and RStudio
  • Clean, manage, and analyze data with R
  • Use the ggplot2 package for graphs and visualizations
  • Solve data management problems using R functions
  • Fit and interpret regression models
  • Test hypotheses and estimate confidence
  • Simplify complex multivariate data with principal components and exploratory factor analysis
  • Make predictions using time series forecasting
  • Create dynamic reports and stunning visualizations
  • Techniques for debugging programs and creating packages

R in Action, Third Edition makes learning R quick and easy. That’s why thousands of data scientists have chosen this guide to help them master the powerful language. Far from being a dry academic tome, every example you’ll encounter in this book is relevant to scientific and business developers, and helps you solve common data challenges. R expert Rob Kabacoff takes you on a crash course in statistics, from dealing with messy and incomplete data to creating stunning visualizations. This revised and expanded third edition contains fresh coverage of the new tidyverse approach to data analysis and R’s state-of-the-art graphing capabilities with the ggplot2 package.

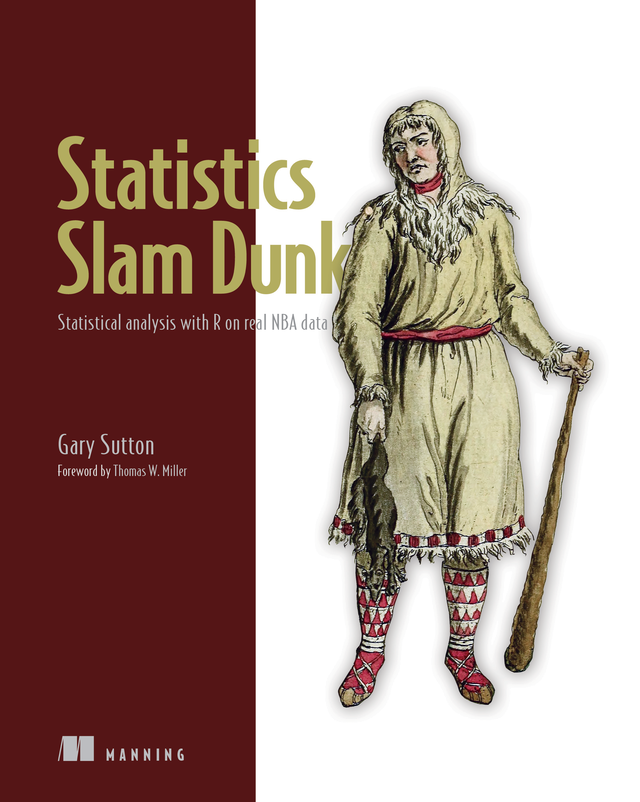
Statistical analysis with R on real NBA data
by Gary Sutton

Learn statistics by analyzing professional basketball data! In this action-packed book, you’ll build your skills in exploratory data analysis by digging into the fascinating world of NBA games and player stats using the R language.

Statistics Slam Dunk is an engaging how-to guide for statistical analysis with R. Each chapter contains an end-to-end data science or statistics project delving into NBA data and revealing real-world sporting insights. Written by a former basketball player turned business intelligence and analytics leader, you’ll get practical experience tidying, wrangling, exploring, testing, modeling, and otherwise analyzing data with the best and latest R packages and functions.

In Statistics Slam Dunk you’ll develop a toolbox of R programming skills including:

  • Reading and writing data
  • Installing and loading packages
  • Transforming, tidying, and wrangling data
  • Applying best-in-class exploratory data analysis techniques
  • Creating compelling visualizations
  • Developing supervised and unsupervised machine learning algorithms
  • Executing hypothesis tests, including t-tests and chi-square tests for independence
  • Computing expected values, Gini coefficients,  z-scores, and other measures

If you’re looking to switch to R from another language, or trade base R for tidyverse functions, this book is the perfect training coach. Much more than a beginner’s guide, it teaches statistics and data science methods that have tons of use cases. And just like in the real world, you’ll get no clean pre-packaged data sets in

Statistics Slam Dunk. You’ll take on the challenge of wrangling messy data to drill on the skills that will make you the star player on any data team.