/dev/reading
Category

Computer Graphics

26 books, 2 subcategories
Order by
View
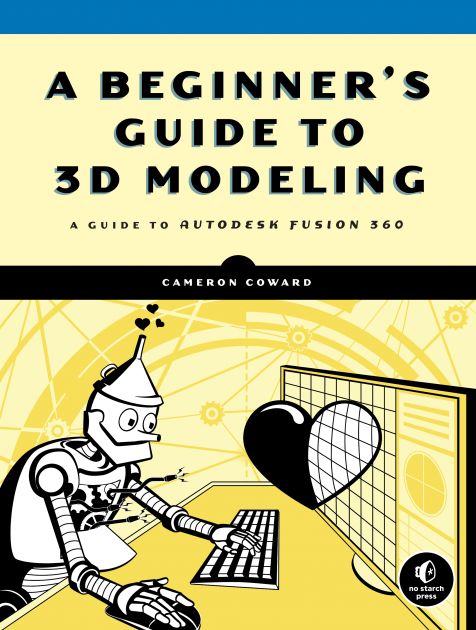
A Guide to Autodesk Fusion 360
by Cameron Coward

A Beginner’s Guide to 3D Modeling is a project-based, straightforward introduction to computer-aided design (CAD). You’ll learn how to use Autodesk Fusion 360, the world’s most powerful free CAD software, to model gadgets, 3D print your designs, and create realistic images just like an engineering professional—with no experience required!

Hands-on modeling projects and step-by-step instructions throughout the book introduce fundamental 3D modeling concepts. As you work through the projects, you’ll master the basics of parametric modeling and learn how to create your own models, from simple shapes to multipart assemblies. Once you’ve mastered the basics, you’ll learn more advanced modeling concepts like sweeps, lofts, surfaces, and rendering, before pulling it all together to create a robotic arm.

You’ll learn how to:

  • Design a moving robotic arm, a door hinge, a teapot, and a 20-sided die
  • Create professional technical drawings for manufacturing and patent applications
  • Model springs and other complex curves to create realistic designs
  • Use basic Fusion 360 tools like Extrude, Revolve, and Hole
  • Master advanced tools like Coil and Thread

Whether you’re a maker, hobbyist, or artist, A Beginner’s Guide to 3D Modeling is certain to show you how to turn your ideas into professional models. Go ahead—dust off that 3D printer and feed it your amazing designs.

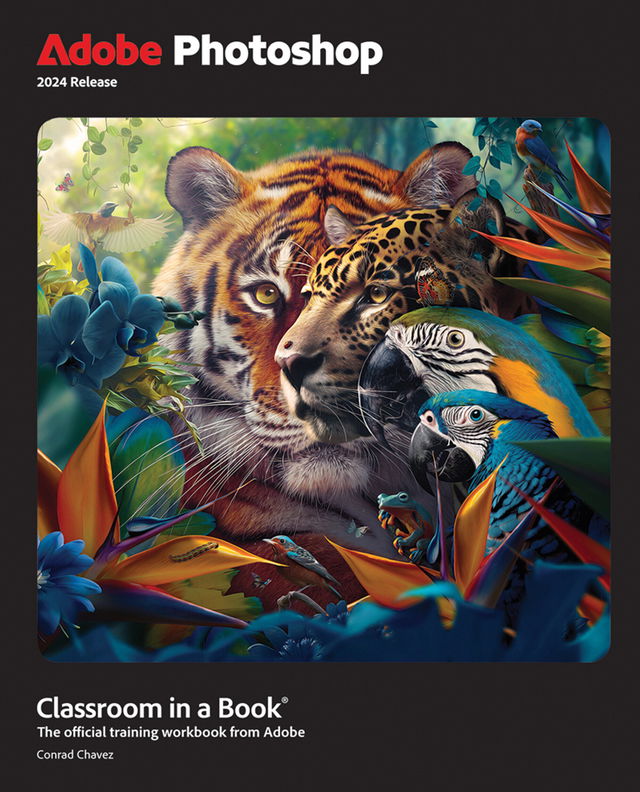
The official training workbook from Adobe
by Conrad Chavez

Adobe Photoshop Classroom in a Book 2024 Release uses real-world, project-based learning to cover the basics and beyond, providing countless tips and techniques to help you become more productive with the program. For beginners and experienced users alike, you can follow the book from start to finish or choose only those lessons that interest you. Learn to:

  • Create and improve digital images with AI-powered tools including Generative Fill.
  • Seamlessly remove backgrounds, replace skies, and repair photos
  • Select subjects with complex outlines, including hair, quickly and precisely
  • Composite multiple images and typography
  • Animate video, still, and type layers and export as a video
  • Edit camera raw images
  • Automate repetitive tasks
  • Save as a Photoshop cloud document to easily edit across desktop and mobile devices
  • Export your work for web, mobile devices, and print

Classroom in a Book®, the best-selling series of hands-on software training workbooks, offers what no other book or training program doesan official training series from Adobe, developed with the support of Adobe product experts.

Purchasing this book includes valuable online extras. Follow the instructions in the book's "Getting Started" section to unlock access to:

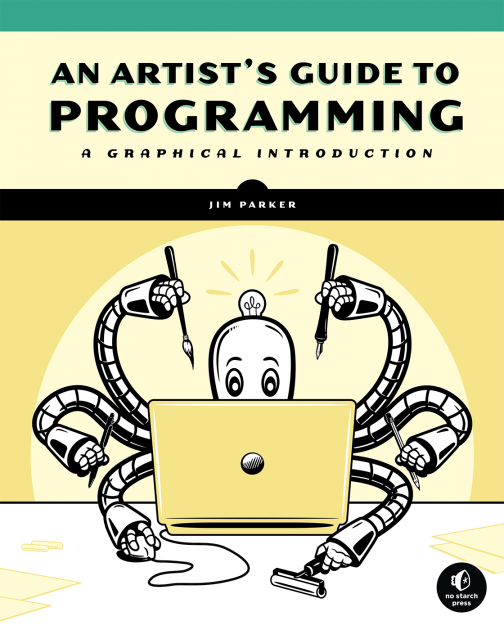
A Graphical Introduction
by Jim Parker

An Artist's Guide to Programming teaches computer programming with the aid of 100 example programs, each of which integrates graphical or sound output. The Processing-language-based examples range from drawing a circle and animating bouncing balls to 3D graphics, audio visualization, and interactive games.

Readers learn core programming concepts like conditions, loops, arrays, strings and functions, as well as how to use Processing to draw lines, shapes, and 3D objects. They’ll learn key computer graphics concepts like manipulating images, animating text, mapping textures onto objects, and working with video. Advanced examples include sound effects and audio visualization, network communication, 3D geometry and animation, simulations of snow and smoke, predator-prey populations, and interactive games.

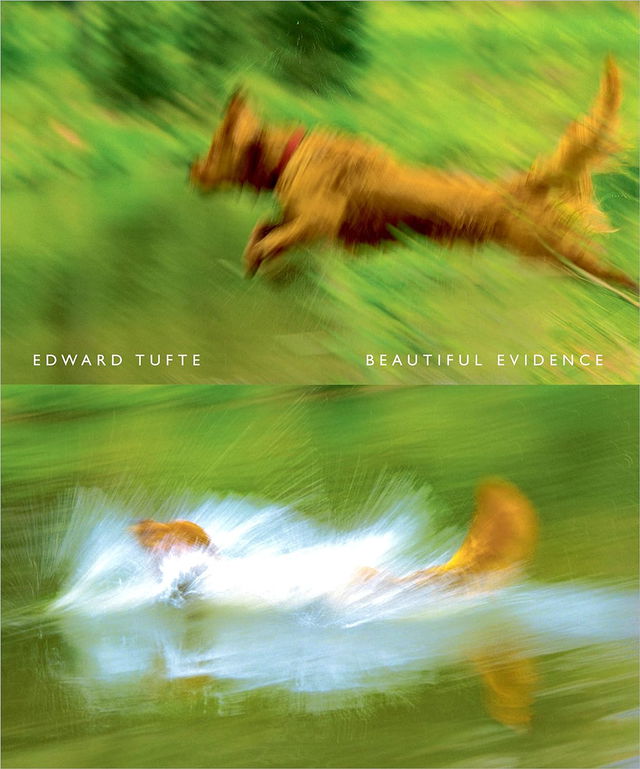
by Edward R. Tufte

Science and art have in common intense seeing, the wide-eyed observing that generates visual information. Beautiful Evidence is about how seeing turns into showing, how data and evidence turn into explanation. The book identifies excellent and effective methods for showing nearly every kind of information, suggests many new designs (including sparklines), and provides analytical tools for assessing the credibility of evidence presentations (which are seen from both sides: how to produce and how to consume presentations). For alert consumers of presentations, there are chapters on diagnosing evidence corruption and PowerPoint pitches. Beautiful Evidence concludes with 2 chapters that leave the world of pixel and paper flatland representations - and move onto seeing and thinking in space land, the real-land of three-space and time.

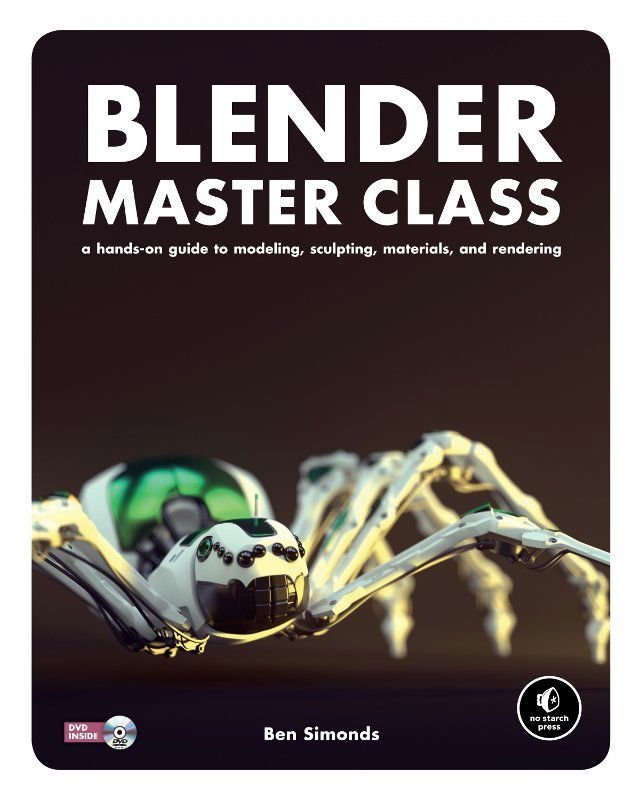
A Hands-On Guide to Modeling, Sculpting, Materials, and Rendering
by Ben Simonds

Blender is a powerful and free 3D graphics tool used by artists and designers worldwide. But even experienced designers can find it challenging to turn an idea into a polished piece.

For those who have struggled to create professional-quality projects in Blender, author Ben Simonds offers this peek inside his studio. You’ll learn how to create 3D models as you explore the creative process that he uses to model three example projects: a muscular bat creature, a futuristic robotic spider, and ancient temple ruins. Along the way, you’ll master the Blender interface and learn how to create and refine your own models.

You’ll also learn how to:

  • Work with reference and concept art in Blender and GIMP to make starting projects easier
  • Block in models with simple geometry and build up more complex forms
  • Use Blender’s powerful sculpting brushes to create detailed organic models
  • Paint textures with Blender and GIMP and map them onto your 3D artwork
  • Light, render, and composite your models to create striking images Each chapter walks you through a piece of the modeling process and offers detailed explanations of the tools and concepts used. Filled with full-color artwork and real-world tips, Blender Master Class gives you the foundation you need to create your own stunning masterpieces.

DVD includes files for each project in the book, as well as extra textures, brushes, and other resources.

Covers Blender 2.6x

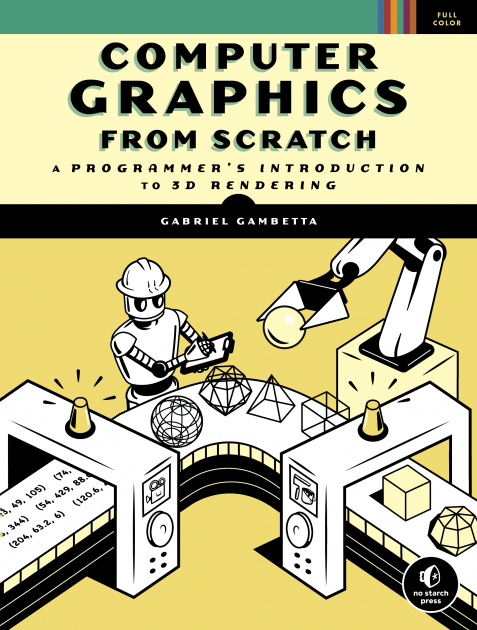
A Programmer's Introduction to 3D Rendering
by Gabriel Gambetta

Computer graphics programming books are often math-heavy and intimidating for newcomers. Not this one. Computer Graphics from Scratch takes a simpler approach by keeping the math to a minimum and focusing on only one aspect of computer graphics, 3D rendering.

You’ll build two complete, fully functional renderers: a raytracer, which simulates rays of light as they bounce off objects, and a rasterizer, which converts 3D models into 2D pixels. As you progress you’ll learn how to create realistic reflections and shadows, and how to render a scene from any point of view.

Pseudocode examples throughout make it easy to write your renderers in any language, and links to live JavaScript demos of each algorithm invite you to explore further on your own.

Learn how to:

  • Use perspective projection to draw 3D objects on a 2D plane
  • Simulate the way rays of light interact with surfaces
  • Add mirror-like reflections and cast shadows to objects
  • Render a scene from any camera position using clipping planes
  • Use flat, Gouraud, and Phong shading to mimic real surface lighting
  • Paint texture details onto basic shapes to create realistic-looking objects

Whether you’re an aspiring graphics engineer or a novice programmer curious about how graphics algorithms work, Gabriel Gambetta’s simple, clear explanations will quickly put computer graphics concepts and rendering techniques within your reach. All you need is basic coding knowledge and high school math. Computer Graphics from Scratch will cover the rest.

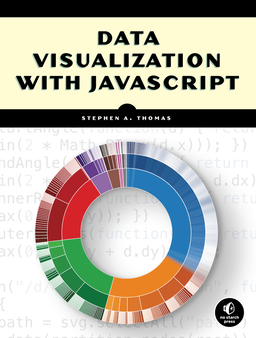
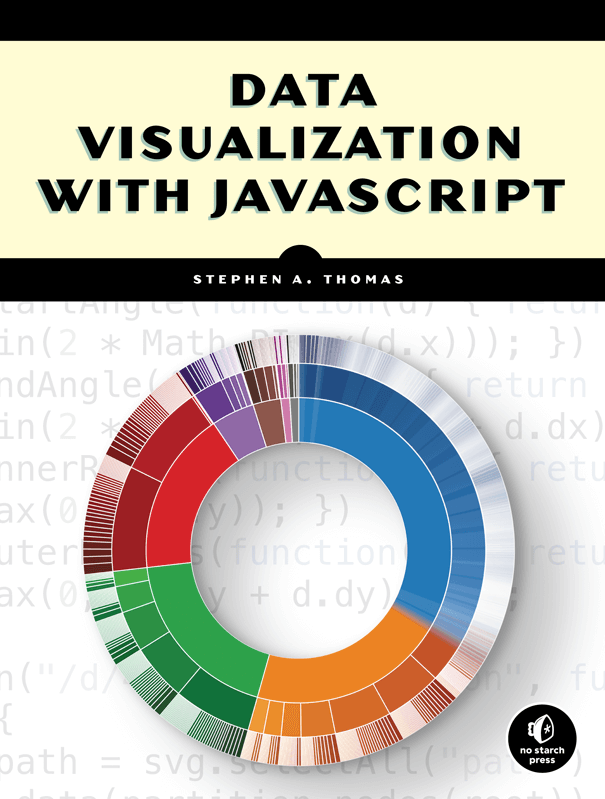
by Stephen A. Thomas

You’ve got data to communicate. But what kind of visualization do you choose, how do you build your visualizations, and how do you ensure that they're up to the demands of the Web?

In Data Visualization with JavaScript, you’ll learn how to use JavaScript, HTML, and CSS to build practical visualizations for your data. Step-by-step examples walk you through creating, integrating, and debugging different types of visualizations and you'll be building basic visualizations (like bar, line, and scatter graphs) in no time.

You'll also learn how to:

  • Create tree maps, heat maps, network graphs, word clouds, and timelines
  • Map geographic data, and build sparklines and composite charts
  • Add interactivity and retrieve data with AJAX
  • Manage data in the browser and build data-driven web applications
  • Harness the power of the Flotr2, Flot, Chronoline.js, D3.js, Underscore.js, and Backbone.js libraries

If you already know your way around building a web page but aren’t quite sure how to build a good visualization, Data Visualization with JavaScript will help you get your feet wet without throwing you into the deep end. You’ll soon be well on your way to creating simple, powerful data visualizations.

Download the source code

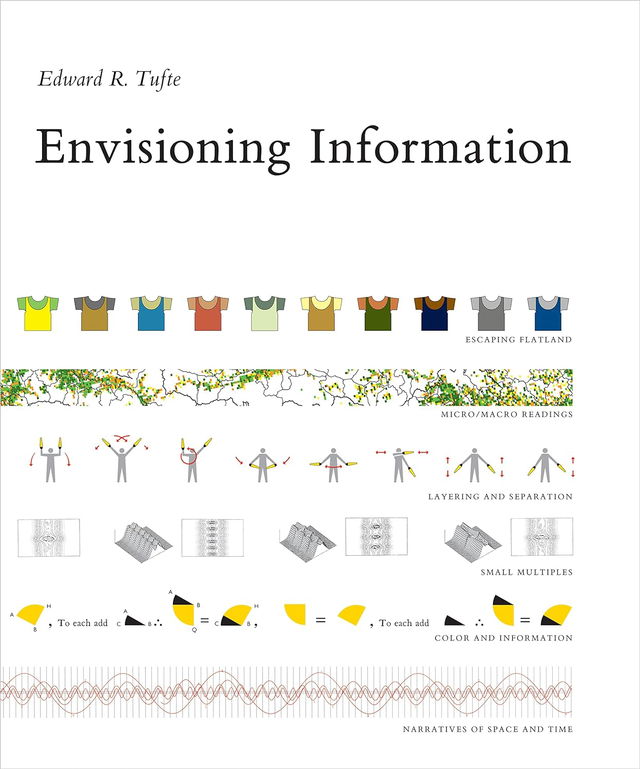
by Edward R. Tufte

This book celebrates escapes from the flatlands of both paper and computer screen, showing superb displays of high-dimensional complex data. The most design-oriented of Edward Tufte's books, Envisioning Information shows maps, charts, scientific presentations, diagrams, computer interfaces, statistical graphics and tables, stereo photographs, guidebooks, courtroom exhibits, timetables, use of color, a pop-up, and many other wonderful displays of information. The book provides practical advice about how to explain complex material by visual means, with extraordinary examples to illustrate the fundamental principles of information displays. Topics include escaping flatland, color and information, micro/macro designs, layering and separation, small multiples, and narratives. Winner of 17 awards for design and content. 400 illustrations with exquisite 6- to 12-color printing throughout. Highest quality design and production.

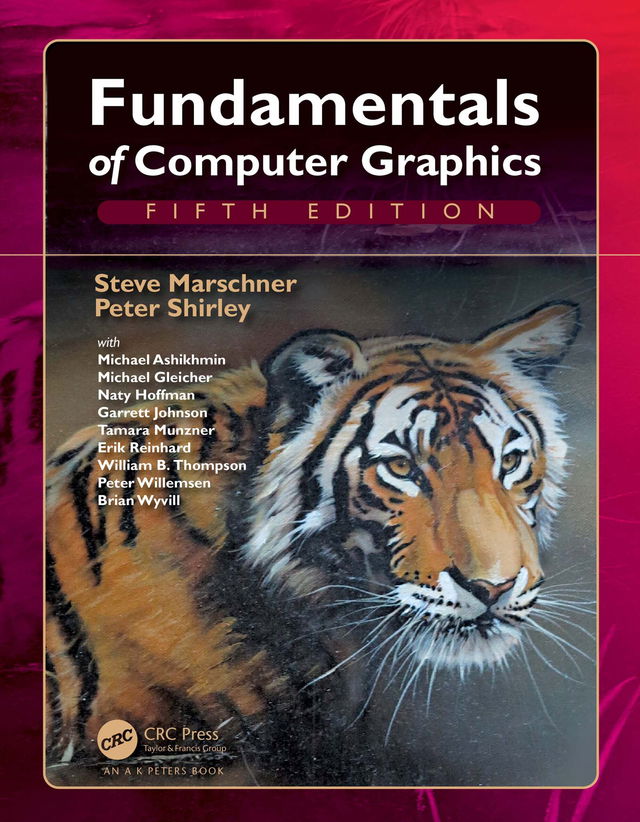
by Steve Marschner and Peter Shirley

Drawing on an impressive roster of experts in the field, Fundamentals of Computer Graphics, Fifth Edition offers an ideal resource for computer course curricula as well as a user-friendly personal or professional reference.

Focusing on geometric intuition, this book gives the necessary information for understanding how images get onto the screen by using the complementary approaches of ray tracing and rasterization. It covers topics common to an introductory course, such as sampling theory, texture mapping, spatial data structure, and splines. It also includes a number of contributed chapters from authors known for their expertise and clear way of explaining concepts.

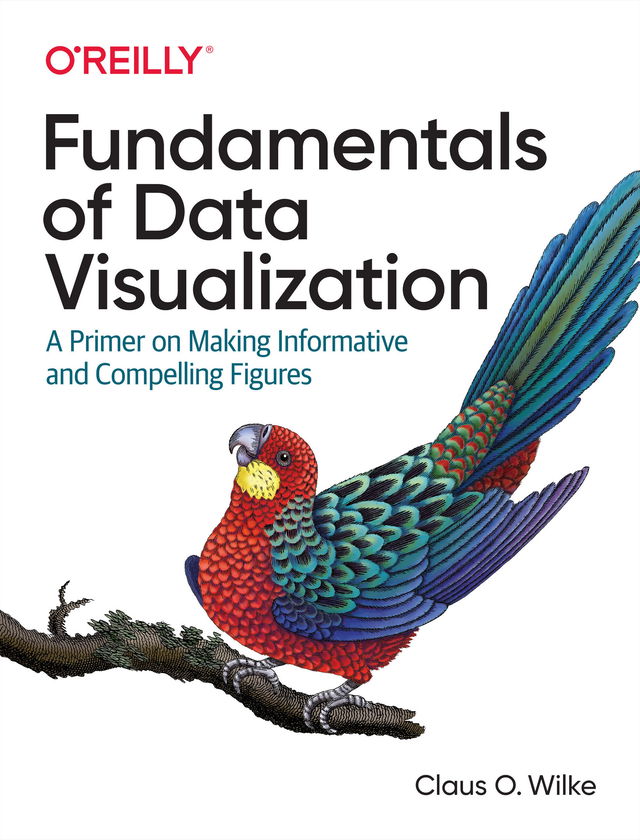
A Primer on Making Informative and Compelling Figures
by Claus O. Wilke

Effective visualization is the best way to communicate information from the increasingly large and complex datasets in the natural and social sciences. But with the increasing power of visualization software today, scientists, engineers, and business analysts often have to navigate a bewildering array of visualization choices and options.

This practical book takes you through many commonly encountered visualization problems, and it provides guidelines on how to turn large datasets into clear and compelling figures. What visualization type is best for the story you want to tell? How do you make informative figures that are visually pleasing? Author Claus O. Wilke teaches you the elements most critical to successful data visualization.

  • Explore the basic concepts of color as a tool to highlight, distinguish, or represent a value
  • Understand the importance of redundant coding to ensure you provide key information in multiple ways
  • Use the book’s visualizations directory, a graphical guide to commonly used types of data visualizations
  • Get extensive examples of good and bad figures
  • Learn how to use figures in a document or report and how employ them effectively to tell a compelling story
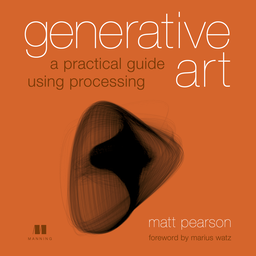
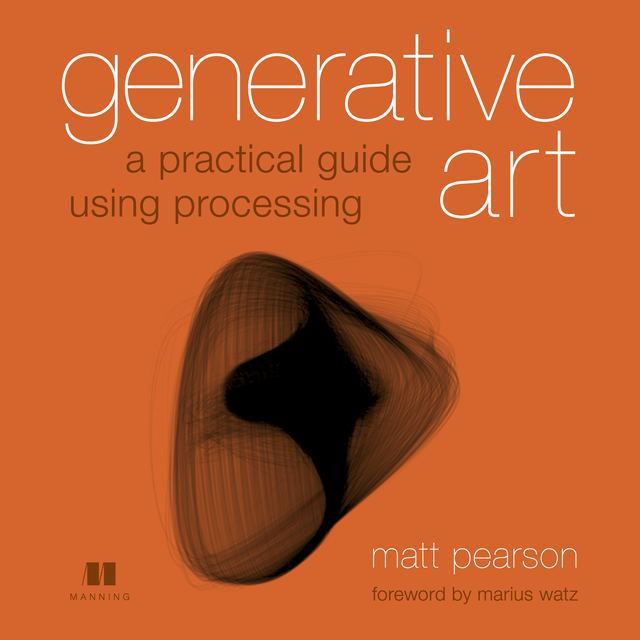
A practical guide using Processing
by Matt Pearson

Generative Art presents both the technique and the beauty of algorithmic art. The book includes high-quality examples of generative art, along with the specific programmatic steps author and artist Matt Pearson followed to create each unique piece using the Processing programming language.

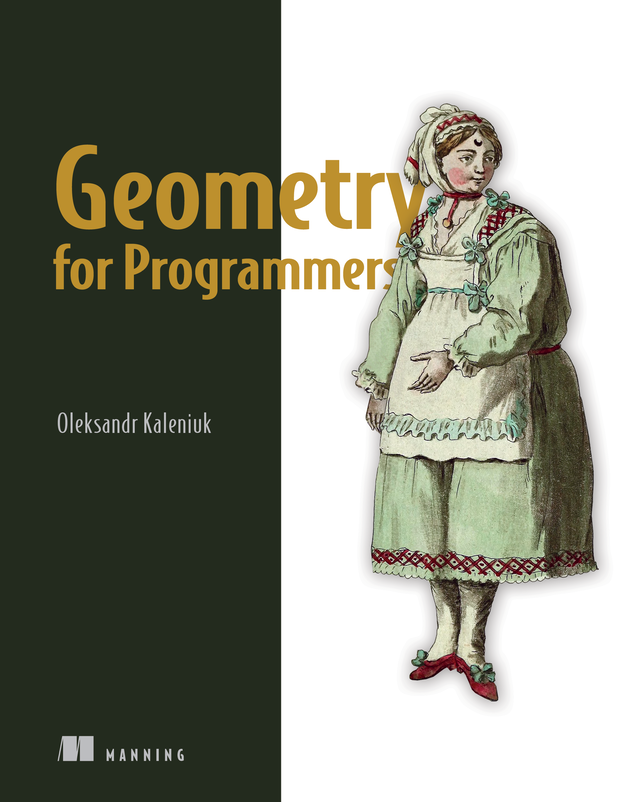
by Oleksandr Kaleniuk

Master the math behind CAD, game engines, GIS, and more! This hands-on book teaches you the geometry used to create simulations, 3D prints, and other models of the physical world.

In Geometry for Programmers you will learn how to:

  • Speak the language of applied geometry
  • Compose geometric transformations economically
  • Craft custom splines for efficient curves and surface generation
  • Pick and implement the right geometric transformations
  • Confidently use important algorithms that operate on triangle meshes, distance functions, and voxels

Geometry for Programmers guides you through the math behind graphics and modeling tools. It’s full of practical examples and clear explanations that make sense even if you don’t have a background in advanced math. You’ll learn how basic geometry can help you avoid code layering and repetition, and even how to drive down cloud hosting costs with more efficient runtimes. Cheerful language, charts, illustrations, equations, and Python code help make geometry instantly relevant to your daily work as a developer.

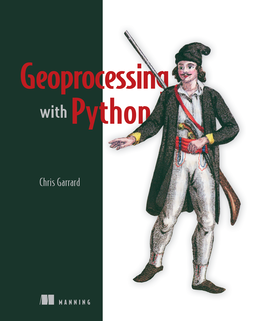
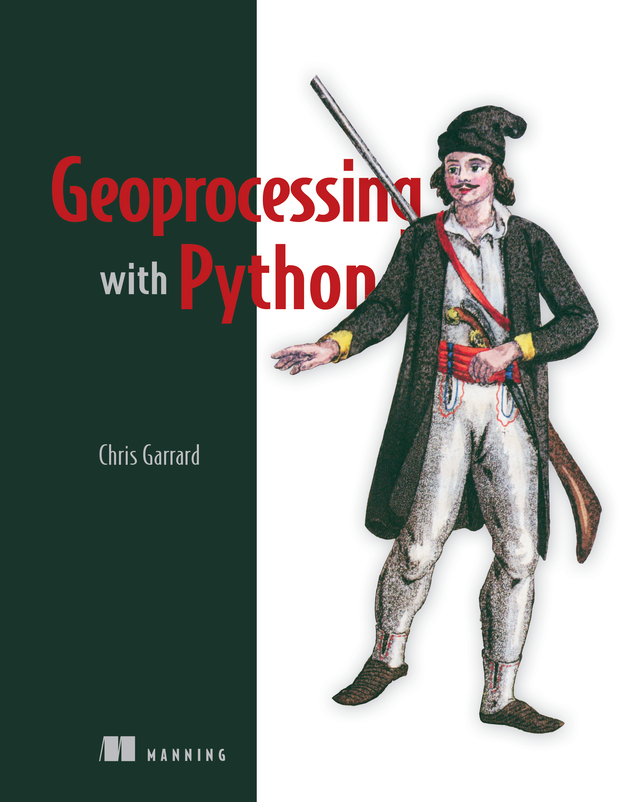
by Chris Garrard

Geoprocessing with Python teaches you how to use the Python programming language, along with free and open source tools, to read, write, and process geospatial data.

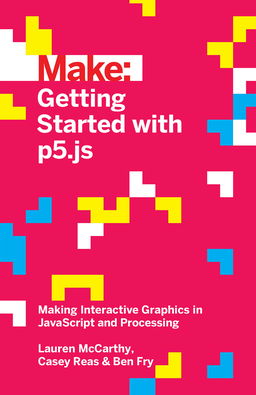
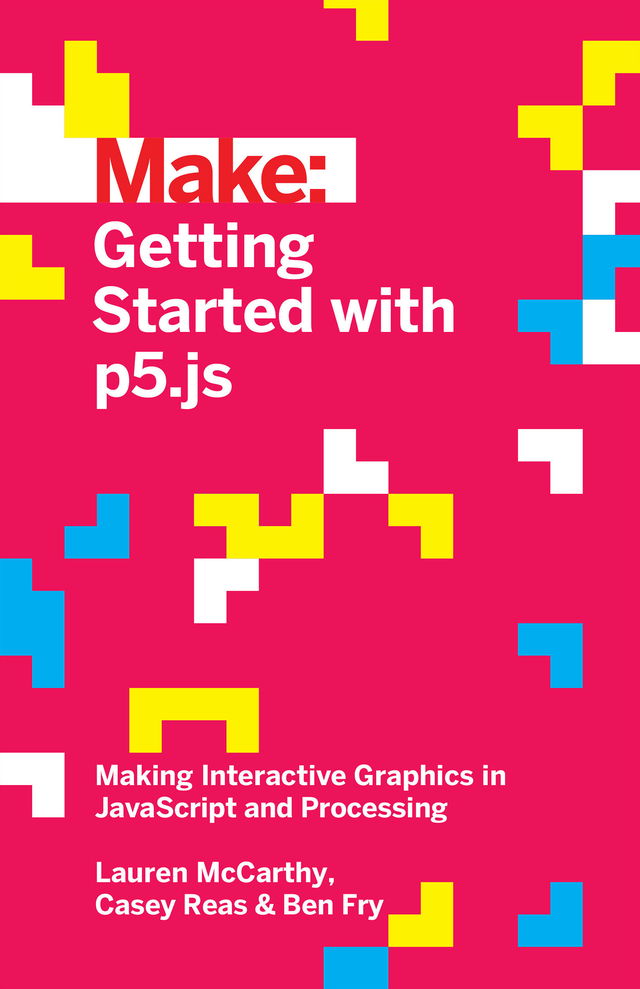
Making Interactive Graphics in JavaScript and Processing
by Lauren McCarthy, Casey Reas and Ben Fry

With p5.js, you can think of your entire Web browser as your canvas for sketching with code!

Learn programming the fun way--by sketching with interactive computer graphics! Getting Started with p5.js contains techniques that can be applied to creating games, animations, and interfaces. p5.js is a new interpretation of Processing written in JavaScript that makes it easy to interact with HTML5 objects, including text, input, video, webcam, and sound. Like its older sibling Processing, p5.js makes coding accessible for artists, designers, educators, and beginners.

Written by the lead p5.js developer and the founders of Processing, this book provides an introduction to the creative possibilities of today's Web, using JavaScript and HTML.

With Getting Started with p5.js, you'll:

  • Quickly learn programming basics, from variables to objects
  • Understand the fundamentals of computer graphics
  • Create interactive graphics with easy-to-follow projects
  • Learn to apply data visualization techniques
  • Capture and manipulate webcam audio and video feeds in the browser
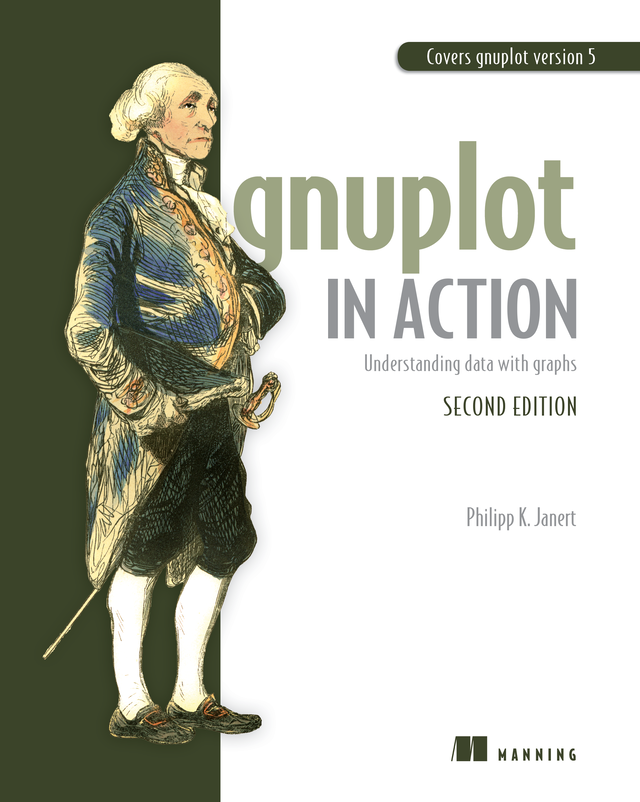
Understanding data with graphs
by Philipp K. Janert

Gnuplot in Action, Second Edition is a major revision of this popular and authoritative guide for developers, engineers, and scientists who want to learn and use gnuplot effectively. Fully updated for gnuplot version 5, the book includes four pages of color illustrations and four bonus appendixes available in the eBook.

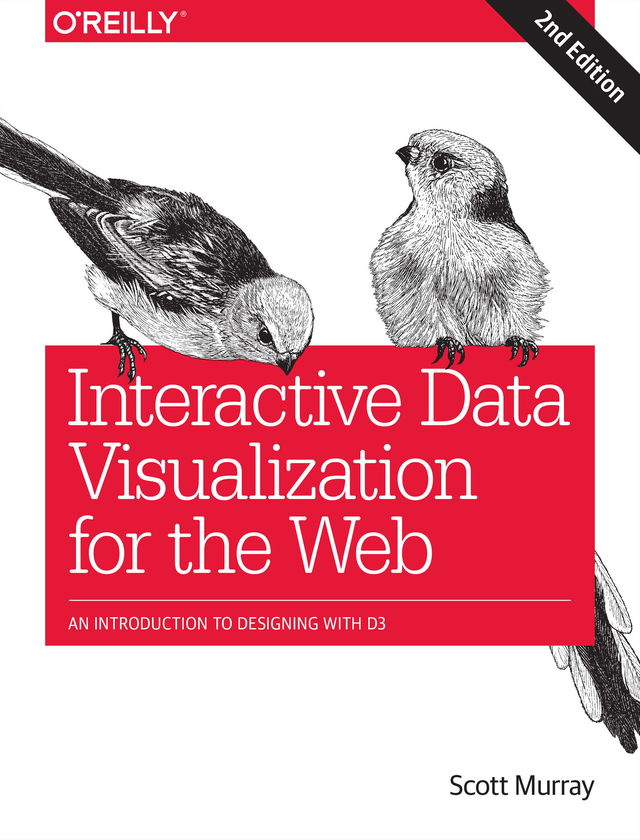
An Introduction to Designing with D3
by Scott Murray

Create and publish your own interactive data visualization projects on the webâ??even if you have little or no experience with data visualization or web development. Itâ??s inspiring and fun with this friendly, accessible, and practical hands-on introduction. This fully updated and expanded second edition takes you through the fundamental concepts and methods of D3, the most powerful JavaScript library for expressing data visually in a web browser.

Ideal for designers with no coding experience, reporters exploring data journalism, and anyone who wants to visualize and share data, this step-by-step guide will also help you expand your web programming skills by teaching you the basics of HTML, CSS, JavaScript, and SVG.

  • Learn D3 with downloadable code and over 140 examples
  • Create bar charts, scatter plots, pie charts, stacked bar charts, and force-directed graphs
  • Use smooth, animated transitions to show changes in your data
  • Introduce interactivity to help users explore your data
  • Create custom geographic maps with panning, zooming, labels, and tooltips
  • Walk through the creation of a complete visualization project, from start to finish
  • Explore inspiring case studies with nine accomplished designers talking about their D3-based projects
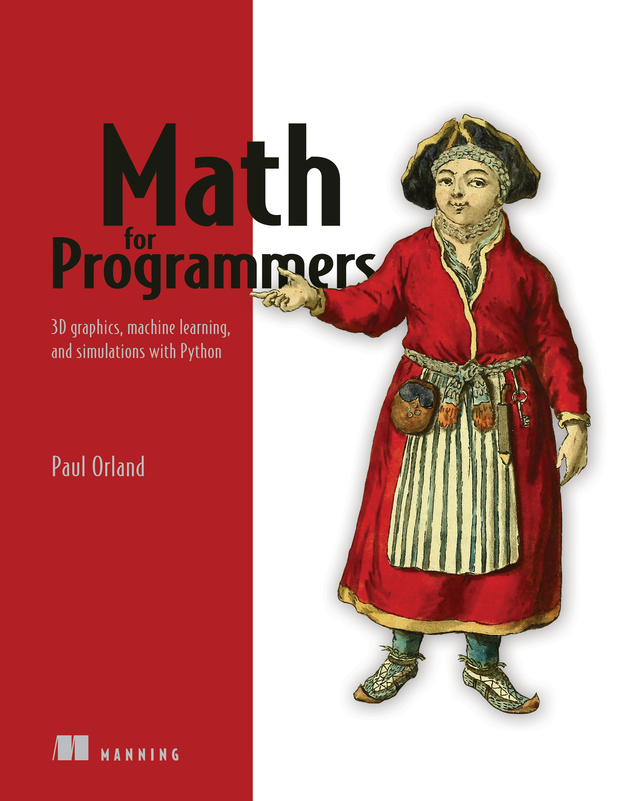
3D graphics, machine learning, and simulations with Python
by Paul Orland

To score a job in data science, machine learning, computer graphics, and cryptography, you need to bring strong math skills to the party.

Math for Programmers teaches the math you need for these hot careers, concentrating on what you need to know as a developer. Filled with lots of helpful graphics and more than 200 exercises and mini-projects, this book unlocks the door to interesting–and lucrative!–careers in some of today’s hottest programming fields.

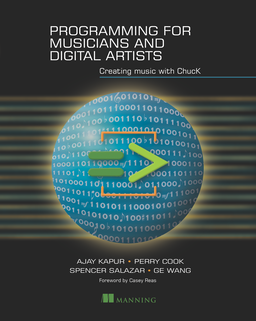
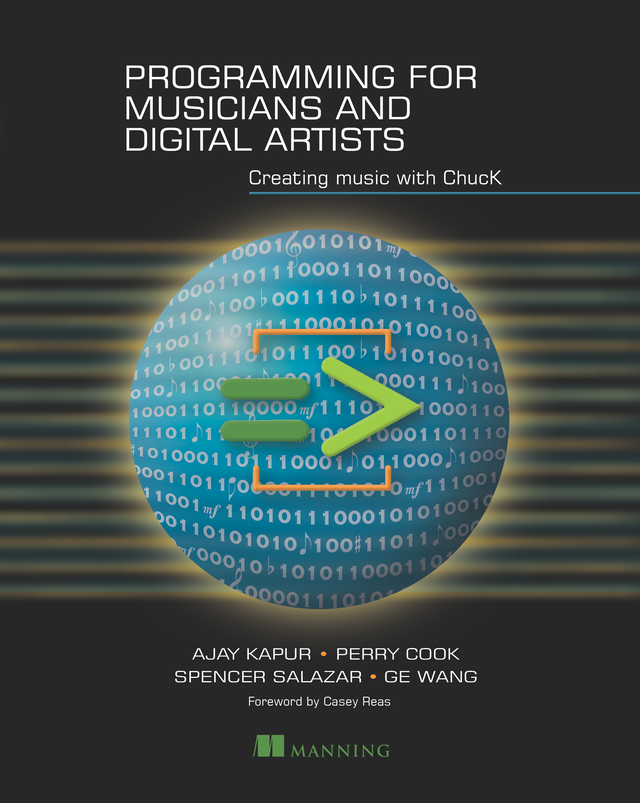
Creating music with ChucK
by Ajay Kapur, Perry Cook, Spencer Salazar and Ge Wang

Programming for Musicians and Digital Artists: Creating Music with ChucK offers a complete introduction to programming in the open source music language ChucK. In it, you'll learn the basics of digital sound creation and manipulation while you discover the ChucK language. As you move example-by-example through this easy-to-follow book, you'll create meaningful and rewarding digital compositions and "instruments" that make sound and music in direct response to program logic, scores, gestures, and other systems connected via MIDI or the network.

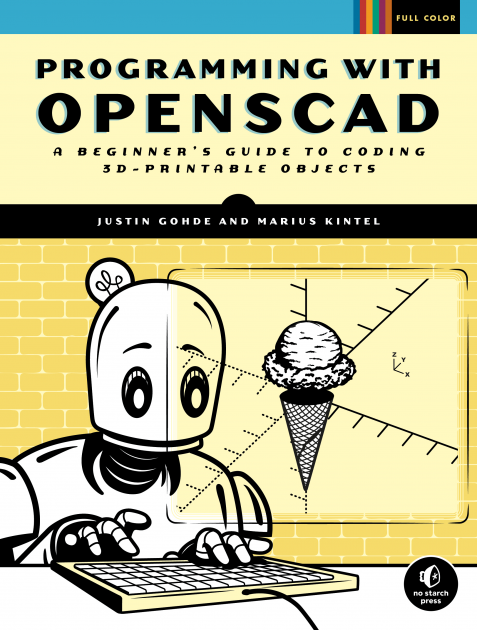
A Beginner's Guide to Coding 3D-Printable Objects
by Justin Gohde and Marius Kintel

OpenSCAD is freely available open source software that enables nondesigners to easily create 3D designs using a text-based programming language. It’s a great language for beginners because the instant 3D visualization gives you immediate feedback on the results of your code. This book channels OpenSCAD’s visual benefits and user-friendliness into a STEAM-focused, project-based tutorial that teaches the basics of coding, 3D printing, and computational thinking while you develop your spatial reasoning by creating 3D designs with OpenSCAD.

Presuming no prior experience with either programming or 3D design, each chapter builds a scaffolded understanding of core concepts. You’ll start by defining, drawing and displaying geometric primitives with text-based code, then expand your creative toolbox with transformation operations – like rotating, reflecting, scaling, and combining shapes.

As the projects become more sophisticated, so will your programming skills; you’ll use loops for replicating objects, if statements for differentiating your designs, and parameterized, self-contained modules to divide longer scripts into separate files. Along the way, you'll learn 3D printing tips so that you can produce physical mementos of your progress and get physical feedback that lets you correct mistakes in real time. In addition, the book provides hands-on and accessible design exercises at the end of each chapter so that you can practice applying new concepts immediately after they are introduced.

You’ll learn:

  • Programming basics like working with variables, loops, conditional statements, and parameterized modules
  • Transformation operations, such as rotate, reflect, and scale, to create complex shapes
  • Extrusion techniques for turning 2D shapes into elaborate 3D designs
  • Computational-thinking concepts, including decomposition, abstraction, and pattern recognition
  • OpenSCAD’s Boolean, Minkowski and hull operations for combining multiple 3D shapes into one
  • 3D design fundamentals, like navigating the xyz-axis, orthogonal vs. perspective views, and constructive solid geometry
  • Organizing bigger designs into separate files to make code more readable and collaborative

Accessibly written for a wide audience (advanced middle schoolers, high school students, college students, artists, makers and lifelong-learners alike), this is the perfect guide to becoming proficient at programming in general and 3D modeling in particular.

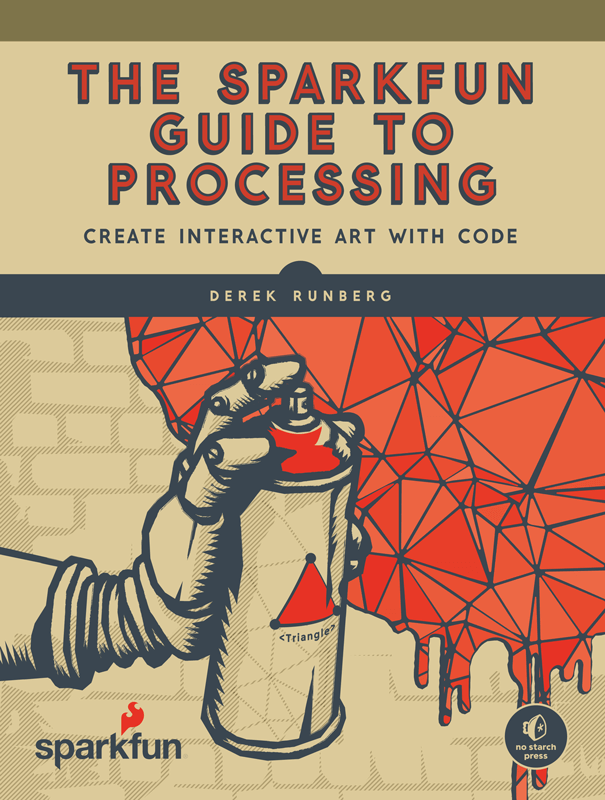
Create Interactive Art with Code
by Derek Runberg

The SparkFun Guide to Processing, the first in the SparkFun Electronics series, will show you how to craft digital artwork and even combine that artwork with hardware so that it reacts to the world around you. Start with the basics of programming and animation as you draw colorful shapes and make them bounce around the screen. Then move on to a series of hands-on, step-by-step projects that will show you how to:

  • Make detailed pixel art and scale it to epic proportions
  • Write a maze game and build a MaKey MaKey controller with fruit buttons
  • Play, record, and sample audio to create your own soundboard
  • Fetch weather data from the Web and build a custom weather dashboard
  • Create visualizations that change based on sound, light, and temperature readings

With a little imagination and Processing as your paintbrush, you’ll be on your way to coding your own gallery of digital art in no time! Put on your artist’s hat, and begin your DIY journey by learning some basic programming and making your first masterpiece with The SparkFun Guide to Processing.

The code in this book is compatible with Processing 2 and Processing 3.

"An excellent primer on this Javaesque language for multimedia art, especially for casual or younger programmers. A quick read through the relevant chapter will have you—within minutes—visualizing data downloaded from online repositories or communicating with an Arduino microcontroller." —IEEE Spectrum

by Cole Nussbaumer Knaflic

This is not a book. It is a one-of-a-kind immersive learning experience through which you can become—or teach others to be—a powerful data storyteller.

Let’s practice! helps you build confidence and credibility to create graphs and visualizations that make sense and weave them into action-inspiring stories. Expanding upon best seller storytelling with data’s foundational lessons, Let’s practice! delivers fresh content, a plethora of new examples, and over 100 hands-on exercises. Author and data storytelling maven Cole Nussbaumer Knaflic guides you along the path to hone core skills and become a well-practiced data communicator. Each chapter includes:

  • Practice with Cole: exercises based on real-world examples first posed for you to consider and solve, followed by detailed step-by-step illustration and explanation
  • Practice on your own: thought-provoking questions and even more exercises to be assigned or worked through individually, without prescribed solutions
  • Practice at work: practical guidance and hands-on exercises for applying storytelling with data lessons on the job, including instruction on when and how to solicit useful feedback and refine for greater impact

The lessons and exercises found within this comprehensive guide will empower you to master—or develop in others—data storytelling skills and transition your work from acceptable to exceptional. By investing in these skills for ourselves and our teams, we can all tell inspiring and influential data stories!

The Definitive Guide to the Graphics Editor
by Dmitry Kirsanov

Dmitry Kirsanov, a former core Inkscape developer, shares his knowledge of Inkscape's inner workings as he shows how to use Inkscape to draw with various tools, work with objects, apply realistic and artistic effects, and more. Step-by-step task-based tutorials show you how to create business cards, animations, technical and artistic drawings, and graphic assets for games.

This second edition covers the new tools, improved text features, advanced new path effects and filters, as well as many new UI conveniences in Inkscape 1.0. A new chapter describes Inkscape's extensions for both users and developers.

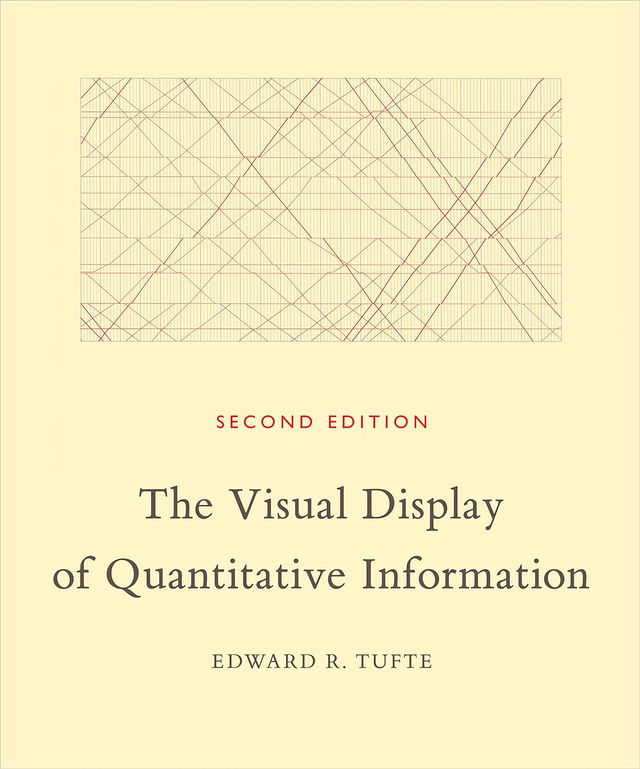
by Edward R. Tufte

The classic book on statistical graphics, charts, tables. Theory and practice in the design of data graphics, 250 illustrations of the best (and a few of the worst) statistical graphics, with detailed analysis of how to display data for precise, effective, quick analysis. Design of the high-resolution displays, small multiples. Editing and improving graphics. The data-ink ratio. Time-series, relational graphics, data maps, multivariate designs. Detection of graphical deception: design variation vs. data variation. Sources of deception. Aesthetics and data graphical displays. This is the second edition of The Visual Display of Quantitative Information. This edition provides excellent color reproductions of the many graphics of William Playfair, adds color to other images, and includes all the changes and corrections accumulated during 17 printings of the first edition.
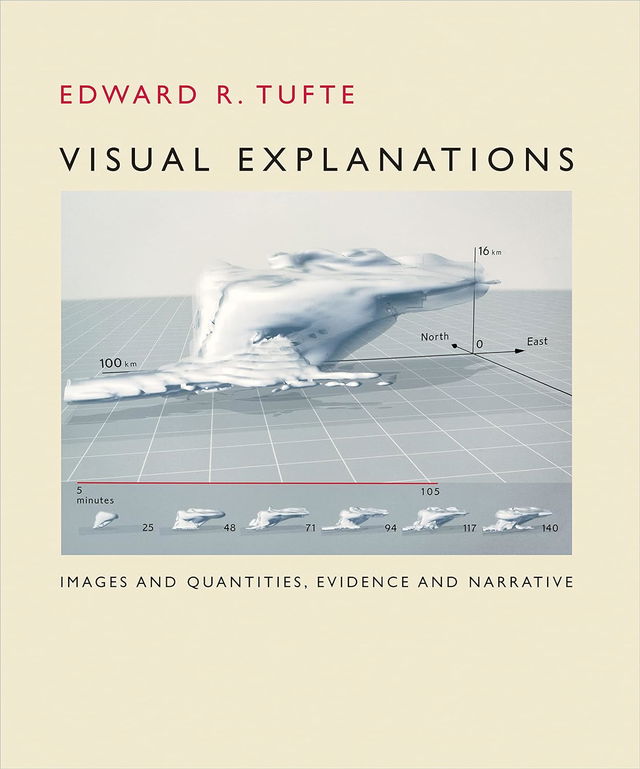
Images and Quantities, Evidence and Narrative
by Edward R. Tufte

Few would disagree: Life in the information age can be overwhelming. Through computers, the Internet, the media, and even our daily newspapers, we are awash in a seemingly endless stream of charts, maps, infographics, diagrams, and data. Visual Explanations is a navigational guide through this turbulent sea of information. The book is an essential reference for anyone involved in graphic, web, or multimedia design, as well as for educators and lecturers who use graphics in presentations or classes.

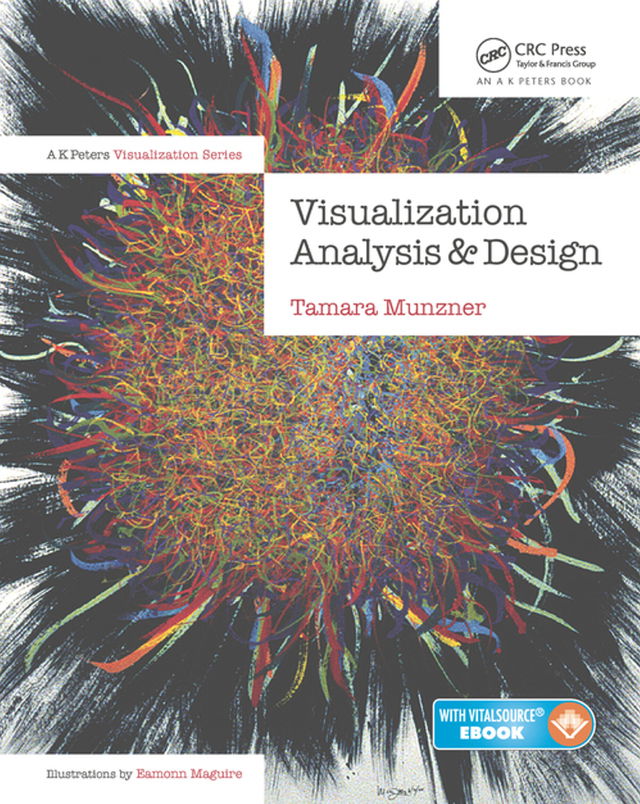
by Tamara Munzner

Learn How to Design Effective Visualization Systems. Visualization Analysis and Design provides a systematic, comprehensive framework for thinking about visualization in terms of principles and design choices. The book features a unified approach encompassing information visualization techniques for abstract data, scientific visualization techniques.

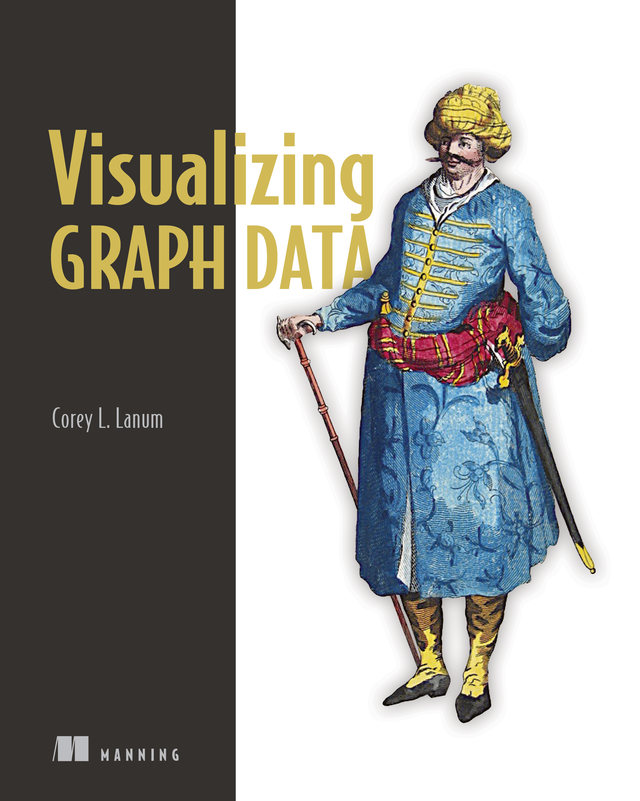
by Corey L. Lanum

Visualizing Graph Data teaches you not only how to build graph data structures, but also how to create your own dynamic and interactive visualizations using a variety of tools. This book is loaded with fascinating examples and case studies to show you the real-world value of graph visualizations.